Posts

THE INTERNAL STRUCTURE OF EARTH

Image
The direct observation of the interior of the earth is not possible as the interior becomes hotter with increasing depth. Much of our knowledge about internal structure of the Earth is revealed primarily by seismic waves (compressional P-wave and Shear S-wave) generated from the earthquake.                    The seismic wave velocities vary with pressure (depth), temperature, mineralogy, chemical composition and degree of partial melting.                                  A sudden change in seismic wave velocity at a seismic discontinuity indicates the change physical and chemical properties of material inside the earth. Discontinuity which lies between crust and mantle at depth of ~70 Km is Mohorovicic discontinuity. Gutenberg's discontinuity lies between the mantle and the core at depth ~2885 Km. Between the inner and outer core, the Lehm...
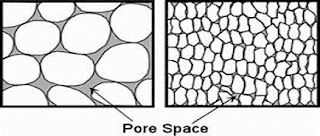
POROSITY, ITS CLASSIFICATION ON THE BASIS OF ITS PROCESSES OF FORMATION

Image
POROSITY:- Porosity is a measure of void space in a material and is a fraction of a volume of void space over the total volume of rock .                            Total Porosity= ( Vv / Vt )*100    TYPES OF POROSITY IN SEDIMENTARY:- 1)  EFFECTIVE POROSITY The void space in rock arranged in such a way that the pores are interconnected with each other then that type is called effective porosity. 2 )   NON-CONNECTED/ INEFFECTIVE POROSITY When the pore space is  isolated  or  is  not  interconnected  to any other pores through which a passage of liquid can’t result, but it is counted in total the porosity of rock known as ineffective porosity.                                                             ...

HYDROGRAPH | there terminologies | type and factors effecting hydrograph

Image
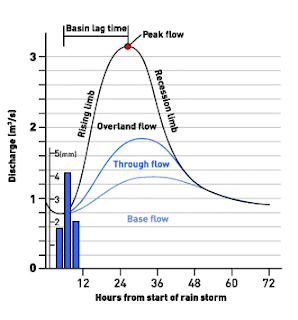
HYDROGRAPH: A hydrograph may be used to show how the water flow in a drainage basin (particularly river runoff) responds to a period of rain.  This type of hydrograph is known as a storm or flood hydrograph and it is generally drawn with two vertical axes. One is used to plot a line graph showing the discharge of a river in cumecs (cubic meters per second) at a given point over a period of time. The second is used to plot a bar graph of the rainfall event which precedes the changes in discharge. The scale on the horizontal axis is usually in hours/days and this allows both the rain event to be recorded and the subsequent changes in river discharge to be plotted. The shape of the hydrograph varies according to a number of controlling factors in the drainage basin but it will generally include the following features. The baseflow of the river represents the normal day to day discharge of the river and is the consequence of groundwater seeping into the river channel. The rising li...